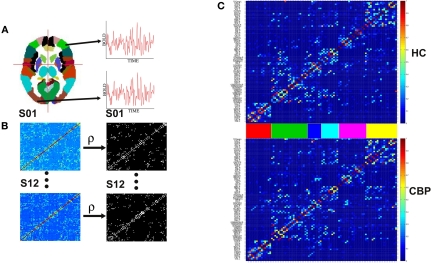
Figure 1.
Steps involved in the construction of brain correlation networks. (A) Average BOLD activity time series for each of the 90 anatomical regions defined in (Tzourio-Mazoyer et al., 2002) are extracted. (B) Partial correlation matrices (Eq. 1) for each of the twelve subjects in each group (left) and adjacency matrices (right) with 1 if two regions have a correlation larger than a certain threshold and 0 otherwise. (C) The weighted group networks obtained from the correlation matrices of the healthy control (HC) (top) and chronic back pain (CBP) (bottom) subjects. The color bars between the panels identify the six communities of the HC group. Same ordering is used for the CBP group.

