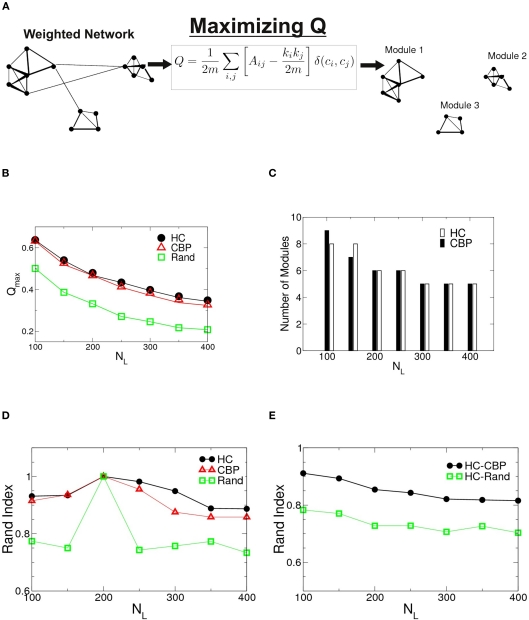
Figure 2.
(A) Schematic representation of the algorithm to find modularity (Eq. 5) identifying nodes mutually connected more strongly than with the rest of the network. (B) Changes in the maximum modularity as a function of the number of links, NL for both groups as well as for an equivalent random network. (C) Number of modules at Qmax as a function of NL for both groups. (D) Robustness of the communities structures. Rand index of partitions obtained for different values of NL = {100,150,250,350,400} compared with those of NL= 200 for HC (black circles), CBP (red triangles), and equivalent random weighted networks (green squares). (E) Rand index between partitions of HC and CBP (black circles) as a measure of module's similarity in both groups. The Rand index is also calculated between HC and equivalent random weighted networks (green squares). The difference between both groups community’ structures is smaller than the difference expected between HC and an equivalent random network.

