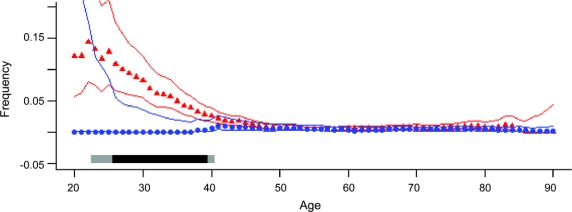
Figure 3 Moving average plots of PARK2 mutation frequency as a function of age
Moving average frequency of PARK2 mutations was estimated as a function of age at onset in patients (red triangles) vs age at blood draw in controls (blue circles) with 95% central posterior probabilities (red and blue lines). Plots show that PARK2 mutation frequency is very high in young-onset Parkinson disease (PD), declines with increasing age at onset, and by age 45 and thereafter, the mutation frequency in PD and control subjects are completely superimposed. Gray bars at the bottom of the graph show the statistical significance of the difference between patients and control subjects, calculated in the moving window (light gray ≥95% probability, dark gray ≥99% probability). Due to few numbers at the extremes, subjects with ages ≤20 or ≥90 years were merged.

