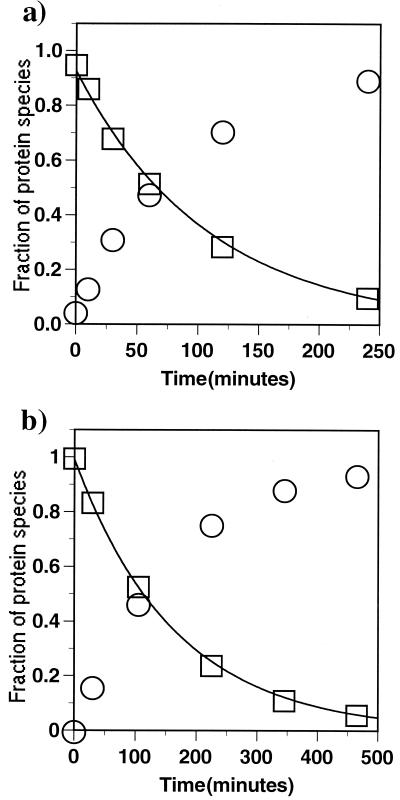
Figure 1.
(a) Decrease in the concentration of des[40–95] at pH 8.0, 15°C in the presence of DTTox and DTTred (100 mM and 260 μM, respectively). □ represents des[40–95] whereas ○ denotes the native protein. (b) Decrease in the concentration of des[65–72] at pH 8.0, 15°C in the presence of DTTox and DTTred (100 mM and 260 μM, respectively). □ represents des[65–72], whereas ○ denotes the native protein. At 15°C and pH 8, the oxidation rates of des[40–95] and des[65–72] are 6.0 and 9.2 × 10² min-1⋅M-1, respectively.

