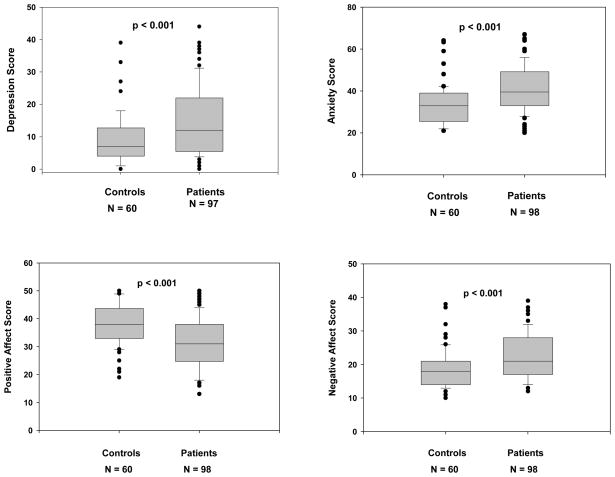
Figure 1.
Comparison of affective outcome measures between control women and women with spontaneous 46,XX primary ovarian insufficiency. Measures were assessed by the Center of Epidemiologic Studies Depression Scale, the state anxiety subscale of the State-Trait Anxiety Inventory, and the Positive and Negative Affect Schedule. Whiskers represent 10 and 90th percentiles and lines in the boxes represent median and inter-quartile range. Each dot represents a data point outside of these ranges. N represents the number of completed instruments.

