Figure 4.
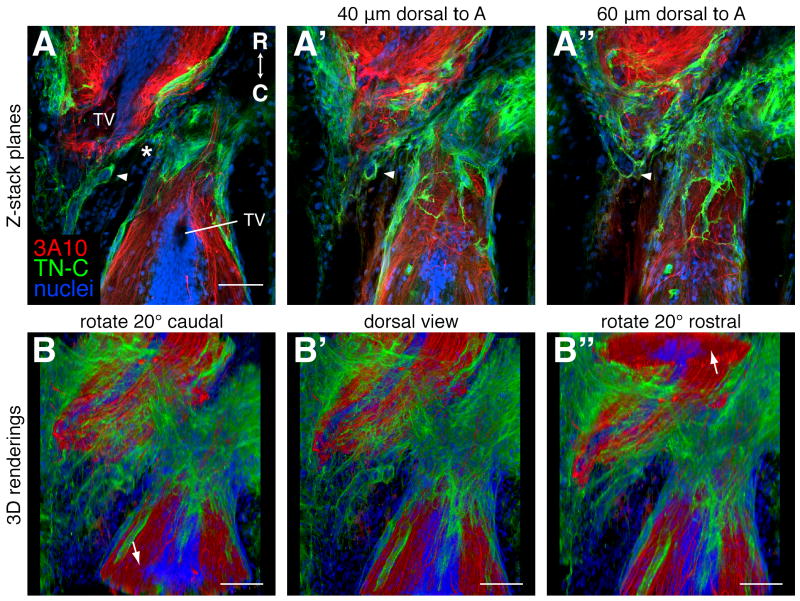
Visualizing 3D relationships. A 3 week regenerating spinal cord was prepared for antibody labeling as outlined in Table 1 and longitudinal planes through the dorsal-ventral axis were imaged on a confocal microscope. Axons were labeled with the 3A10 antibody (red), the extracellular matrix with a TN-C antibody (green), and nuclei with SYTOX green (blue). Rostral is up. A-A″: Single confocal planes through the level of the terminal vesicles (TV, A), and 40 μm (A′) and 60 μm (A″) dorsal to the TVs. The arrowheads mark TN-C lined tube-like structures that can be seen to be connected when the whole z-stack is viewed (see supplemental movie 1). The asterisk marks the injury site. B-B″: Snapshots of a movie of the entire z-stack rendered in 3D with Fluorender and rotated around the horizontal axis (supplemental movie 2). B: A dorsal view rotated 20° to reveal a cross section of the spinal cord caudal to the injury (arrow). B′: A flat dorsal view. B″: A dorsal view rotated 20° to reveal a cross section of the spinal cord rostral to the injury (arrow). Scale bars: 100 μm (A-A″ are the same scale).

