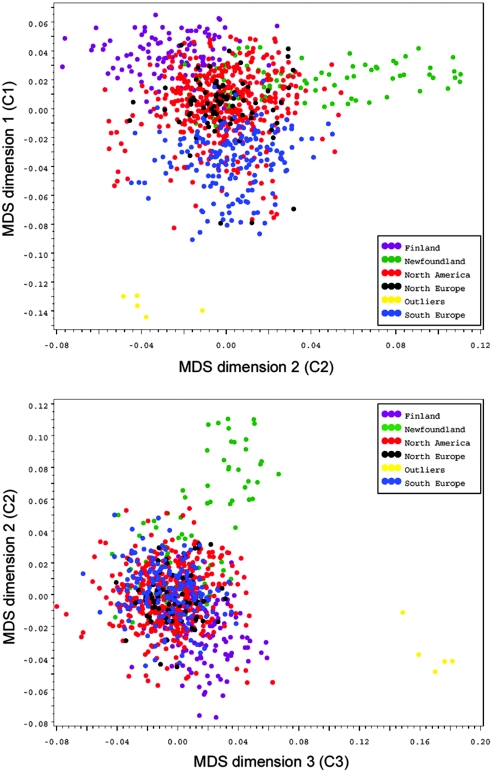
Figure 1.
Detection and adjustment of population structure by multidimensional scaling (MDS). C1 separates patients along a northwest-southeast axis of their European ancestry. North Americans form an admixed group along this axis. C2 separates the Fins from the Newfoundlanders. Five outliers were subsequently identified to be black.

