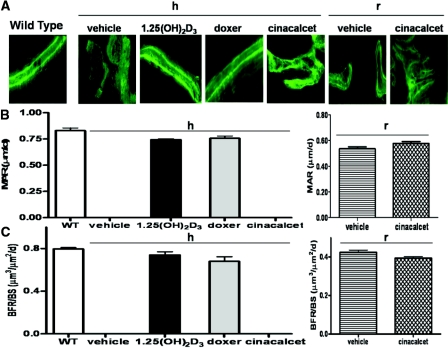
Figure 3.
Treatment of osteomalacic null mice with active vitamin D compounds but not with cinacalcet normalizes MAR and BFR/BS. Dynamic histomorphometry results are shown. (A) Photomicrographs of fluorescence double calcein labeling of bone: in wild-type (WT) mice; in 1α(OH)ase null mice [1α(OH)ase−/−] on a high-calcium intake (h) treated with vehicle, 1,25(OH)2D3, doxercalciferol, and cinacalcet; in 1α(OH)ase null mice on a rescue diet (r) treated with vehicle, and cinacalcet. Magnification, ×200. (B) MARs, calculated from double calcein labeling as described in Concise Methods: in wild-type mice; in 1α(OH)ase null mice on a high-calcium intake (hours) treated with 1,25(OH)2D3 and doxercalciferol; in 1α(OH)ase null mice on a rescue diet treated with vehicle, and cinacalcet. Each value is the mean ± SEM. (C) BFR/BS, calculated as described in Concise Methods: in WT mice; in 1α(OH)ase null mice on a high-calcium intake (hours) treated with 1,25(OH)2D3 and doxercalciferol; in 1α(OH)ase null mice on a rescue diet treated with vehicle, and cinacalcet. Each value is the mean ± SEM. Number of replicates for MAR and BFR/BS from left to right are as follows: 3 for WT; 4 for 1,25(OH)2D3, and 5 for doxercalciferol for 1α(OH)ase−/− mice on a high-calcium intake; 8 for vehicle, and 8 for cinacalcet on a rescue diet. MAR and BFR could not be calculated for vehicle-treated and cinacalcet-treated 1α(OH)ase null mice on a high-calcium intake (h) in view of the indistinct calcein labeling in the osteomalacic bone of these mice, which precluded calculation of interlabel width. Nevertheless, the results of these treatment arms are denoted in Figure 3, B and C, as zero.

