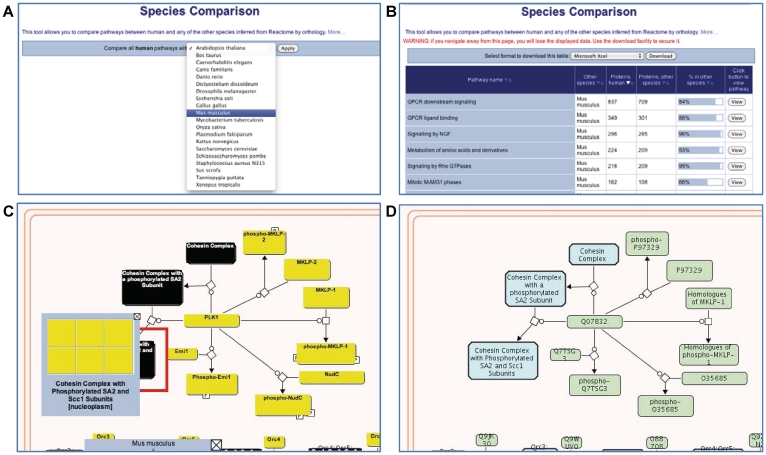
Figure 2.
Species comparison tool and model organism pathway diagrams. (A) A drop-down menu is used to select the model organism species. (B) Results for the comparison of human and mouse pathways. Each row in the table is a pathway; the columns are pathway name, model organism name, number of proteins in the human pathway, number of orthologous proteins in the inferred model organism pathway, a graphical representation of the ratio of these two values and a ‘View’ button that creates a pathway diagram. ‘Sort’ buttons at the top of each column allow the table to be re-ordered according to cell contents in that column. (C) The pathway browser displaying the comparison of the human and mouse Mitotic M-M/G1 pathways. Physical entities in the pathway diagram are color-coded: gray, no match; black, a complex (multicomponent) entity; and yellow, the protein’s ortholog is present in human. (D) The pathway browser displaying the inferred mouse Mitotic M-M/G1 pathway.

