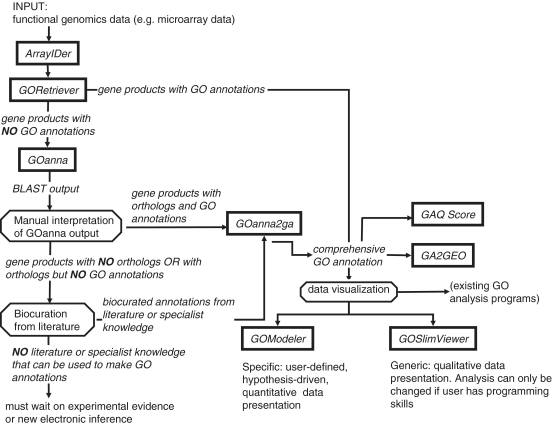
Figure 3.
AgBase tools for functional analysis using the GO. This figure shows the individual AgBase tools for functional analysis of the GO and how they can be used sequentially as a pipeline to provide GO annotations and functional modeling for data sets. Square boxes represent AgBase tools; octagons represent manual steps or checks in the process.

