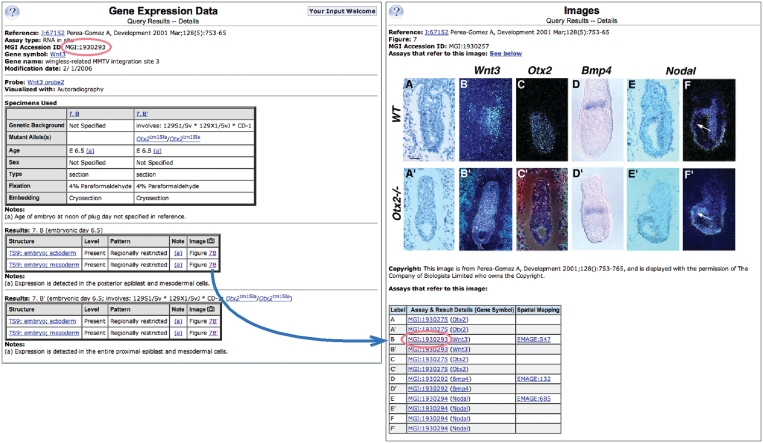
Figure 1.
Detailed gene expression data annotations and images. An assay record for Wnt3 (left) and the accompanying image page (right). The assay page includes: publication reference, gene symbol and name, link to probe/antibody information, specimen details, and the expression annotations for each specimen. Annotations include the anatomical structures in which expression was analyzed and the strength of expression in these structures. They refer to corresponding figures in publications or electronic submissions. Whenever possible, the images are included in GXD and assay records link to those images. The image page includes: publication reference, figure label, the figure, a caption and a copyright statement of the journal or the submitter. Figures from publications often include several image panes analyzing different genes and/or genetic backgrounds. The table below the figure indicates each pane and its corresponding assay record with links to that record, as illustrated by the red circle. For images that have been spatially mapped onto the Edinburgh Mouse Atlas, the table provides a link to the corresponding entry in EMAGE.

