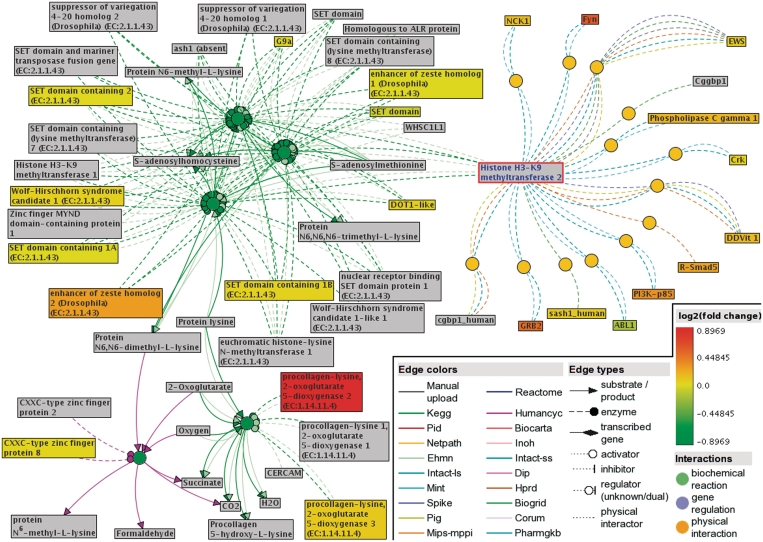
Figure 2.
A functional interaction sub-network visualized by ConsensusPathDB’s new network visualization framework. This sub-network defines the neighborhood-based entity set centered by SUV39H2 (Histone H3-K9 methyltransferase 2, highlighted with red frame in the network) and containing its direct physical interactors, as well as enzymes of neighboring biochemical reactions. The network consists of 13 physical interactions (orange circles) and five biochemical reactions (green circles) from nine different databases (interaction origins are encoded as edge colors). Gene expression data by Yu et al. (20) are overlaid as log2(fold change) values on the physical entity nodes (rectangles). Protein products of measured genes are colored according to the fold expression change (see legend), the rest of the physical entities in the network are gray. Based on the Yu et al. data, the Wilcoxon enrichment analysis tool of ConsensusPathDB suggests that members of this neighborhood-based entity set show jointly significant increase in transcription levels in metastatic prostate cancer compared to primary prostate carcinoma.

