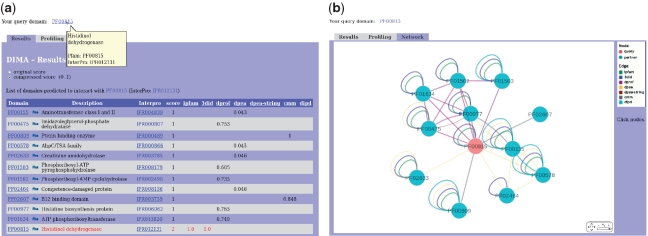
Figure 2.
(a) DIMA results are presented in tabular form. The table provides information on interacting partners, their descriptions, InterPro associations and scores. (b) Dynamic graphical representation of a domain interaction network by Cytoscape Web. Pfam domains are shown as blue circles. Edges represent predicted or known interactions and are colored according to computational methods and data sources used (e.g. iPfam interactions; green, DPEA interactions; yellow, etc.). The edge width represents the interaction score. The query node(s) are shown in red.

