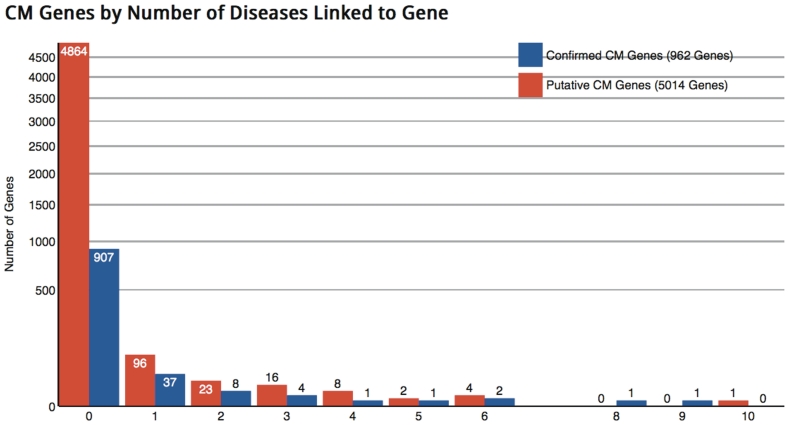
Figure 1.
Portion of the DAnCER statistics page. Histogram summarizing disease annotations for human CM genes. Bars represent the number of genes in the dataset (vertical axis, logarithmic scale), associated with a given number of distinct disease annotations in OMIM (32) (horizontal axis). Shown are disease associations for genes with a confirmed CM function (blue bars), and disease associations for genes whose CM function has been inferred by computational methods and not yet confirmed (red bars). The majority of genes have only one disease association.

