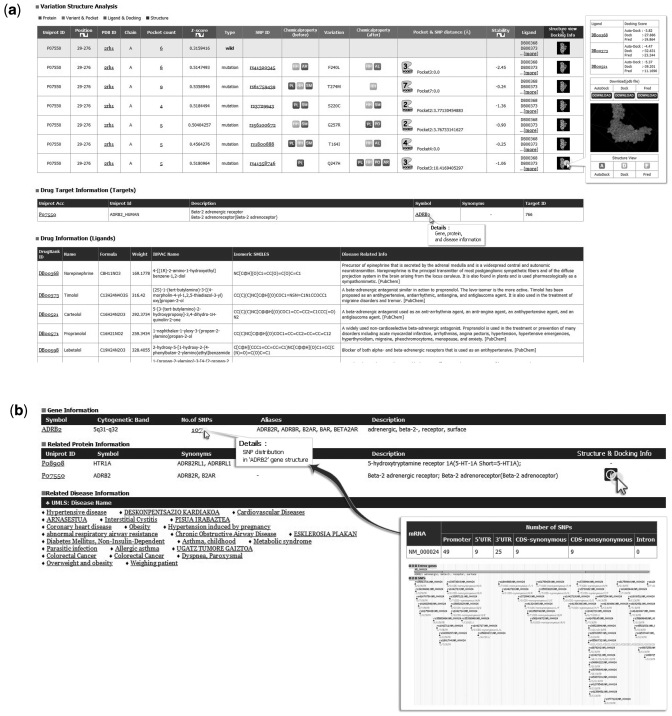
Figure 2.
Query table results and graphic viewer. (a) The server displays information on structures of wild-type and mutant proteins and drug docking found as results for a protein query. The ‘distance between pocket and SNP’ column indicates a pocket located close to a SNP and the distance between a pocket and SNP. The ‘structure view’ column provides the structures of the wild-type and SNP mutant proteins and docking with ligands. (b) Clicking on the gene symbol in the results table (a) allows the user to see the SNP distribution located in the gene structure, protein and disease information.

