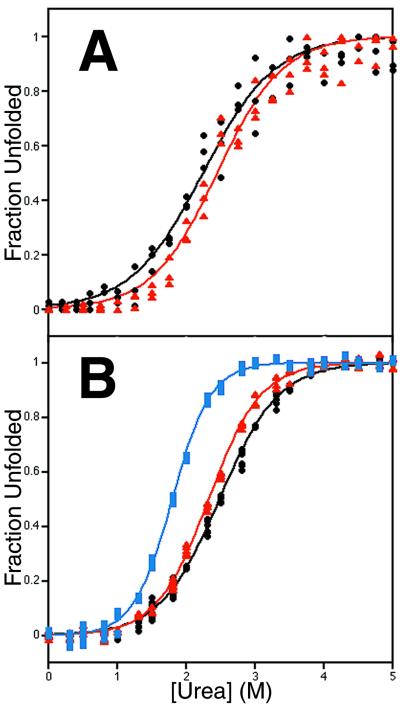
Figure 5.
Denaturation of gelsolin WT and D187N S2 and WT, D187N, and D187Y S2loop as a function of urea concentration. Data are shown in black circles for the WT, in red triangles for D187N, and in blue squares for D187Y. Solid lines represent the best fits to Eq. 3 via a nonlinear least squares analysis. (A) Denaturation of gelsolin S2 WT and D187N monitored by fluorescence intensity at 341 nm (10% glycerol, 4°C). (B) Urea-induced denaturation of gelsolin S2loop WT, D187N, and D187Y monitored by CD ellipticity at 217 nm (4°C).

