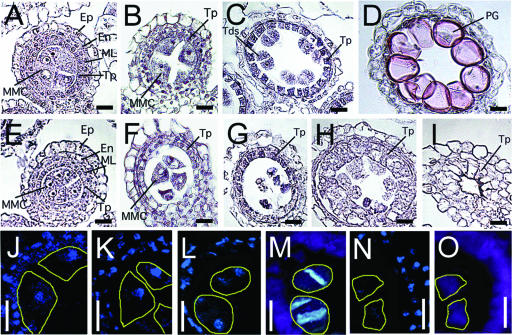
Figure 7.
Anther Development in Wild-Type and gamyb-1 Plants.
(A) to (D), (J), (L), and (M) Wild type.
(E) to (I), (K), (N), and (O) gamyb-1.
(A) to (I) Samples from plants stained with hematoxylin.
(J) to (L) and (N) Samples from plants stained with DAPI to detect nuclei.
(M) and (O) Samples from plants stained with aniline blue to detect callose walls.
(A) and (E) Cross-sections of anthers before meiotic cell division.
(B), (F), (J), and (K) Cross-sections of anthers at the premeiotic cell division stage.
(C), (G), and (L) to (O) Cross-sections of anthers at the meiotic stage.
(D) Cross-section of the developed wild-type anther.
(H) and (I) Cross-sections of shrunken anthers of gamyb-1. The tapetum cells expanded as the anther aged.
The yellow lines in (J) to (O) indicate the section of the cells observed under the bright field. En, endothecium; Ep, epidermis; ML, middle layer; MMC, microspore mother cell; PG, pollen grain; Tds, tetrads; Tp, tapetum. Bars = 25 μm.

