Figure 2.
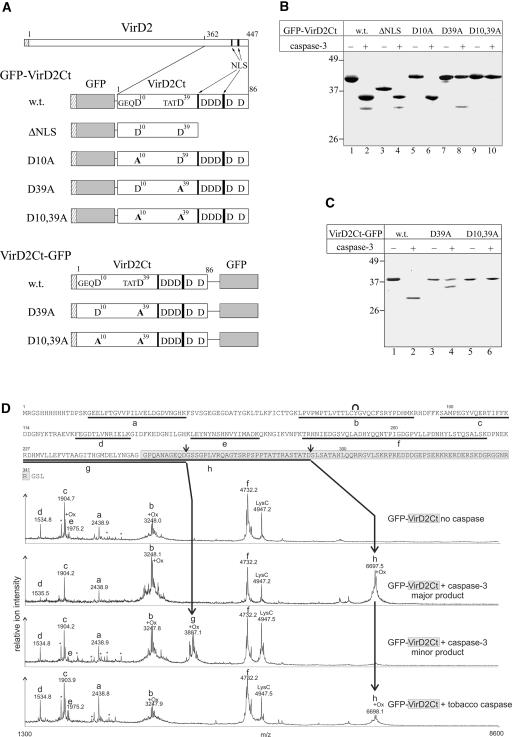
Identification of caspase-3 Cleavage Sites in VirD2.
(A) Scheme of VirD2 and VirD2Ct fused to GFP. Hatched rectangles at the N termini of recombinant proteins represent the (His)6 tags. The GFP moiety is shown in gray. Arrows point to two blocks of basic amino acids (black bars) representing the bipartite NLS of VirD2. All of the D residues present within VirD2Ct are indicated; those corresponding to the caspase cleavage sites are numbered and preceded by the upstream residues. Mutations are given in boldface. The relative sizes of the recombinant proteins are not shown to scale.
(B) Fragmentation of GFP-VirD2Ct wild-type (w.t.) and mutant proteins (designated as in [A]) with caspase-3.
(C) caspase-3–mediated fragmentation of VirD2Ct-GFP.
Reaction mixtures were resolved by 12% SDS-PAGE followed by Coomassie blue staining. The positions of the molecular mass markers are indicated at left.
(D) Mass spectrometric LysC peptide mapping of caspase cleavage sites. The complete amino acid sequence of the GFP-VirD2Ct protein is given at top. The VirD2Ct part of the sequence is highlighted in light gray. Peptide ions in the MALDI-TOF spectra are assigned to the GFP-VirD2Ct sequence as follows: residues 16 to 38 (peak a), 65 to 91 (peak b), 98 to 113 (peak c), 126 to 138 (peak d), 153 to 168 (peak e), 179 to 221 (peak f), 227 to 263 (peak g), and 227 to 292 (peak h). Background signals found in LysC digestions of control samples are marked with asterisks. The peak at m/z 4947.7 is the LysC autoproteolysis product that includes residues 156 to 203. The internal cyclization of the GFP chromophore in peptide b is symbolized with a curve above the sequence. Doublet signals that result from Met oxidation (+16 D) are marked with +Ox. Small arrows above the protein sequence indicate the identified caspase cleavage sites. The mass spectrum at bottom refers to the fragment generated by the plant caspase cleavage and is provided to permit its direct comparison with the spectra of caspase-3–generated fragments.

