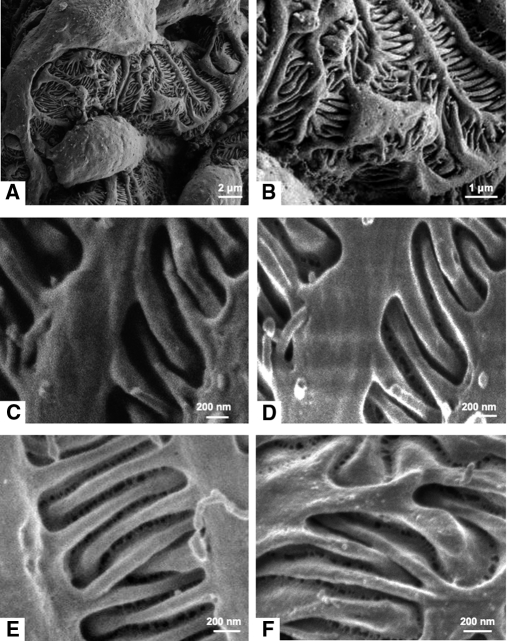
Figure 1.
Visualization of epithelial filtration pores using an in-lens detector with SEM. Representative scanning electron photomicrographs from Wistar rat, taken at low and high magnifications (A: 12,000×; B: 36,000×; C and D: 60,000×; E: 80,000×; F: 100,000×) with conventional detector (A–C) and in-lens detector (D–F) for secondary electrons. In-lens photomicrographs of samples dehydrated with a critical point dryer (A–E) or HMDS (F).

