Figure 8.
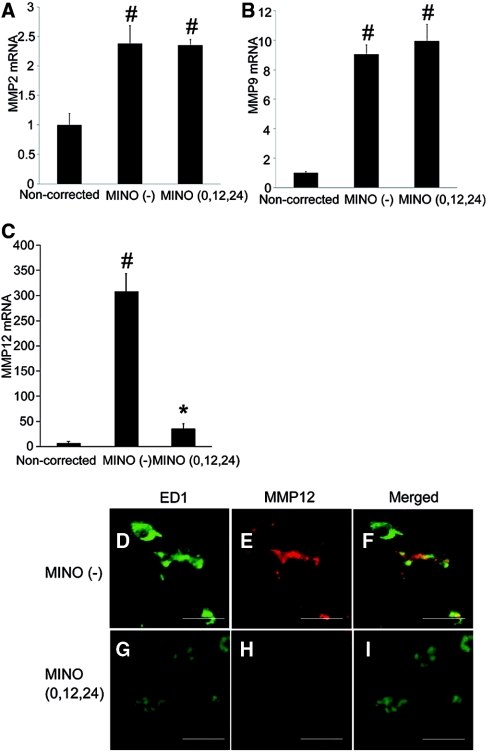
Minocycline suppresses the expression of MMP12 in microglia. (A through C) The mRNA expression of MMP2 (A), ΜΜP9 (B), and MMP12 (C) was significantly increased in the MINO (−) group as compared with the noncorrected group. The mRNA expression of MMP12 was significantly decreased by minocycline treatment (C). The amount of mRNA was determined using quantitative RT-PCR. The values are normalized to β-actin RNA. All of the values are expressed as the means ± SEM (n = 5). #P < 0.05 compared with the noncorrected group. *P < 0.05 compared with the MINO (−) group. (D through I) Double immunostaining for ED1 (D and G) and MMP12 (E and H). (D through F) MINO (−) group. (G through I) MINO (0,12,24) group. Immunoreactivity of ED1 (G) and MMP12 (Η) was reduced in the MINO (0,12,24) group compared with those of the MINO (−) group (D and E, respectively). The scale bars show 20 μm.

