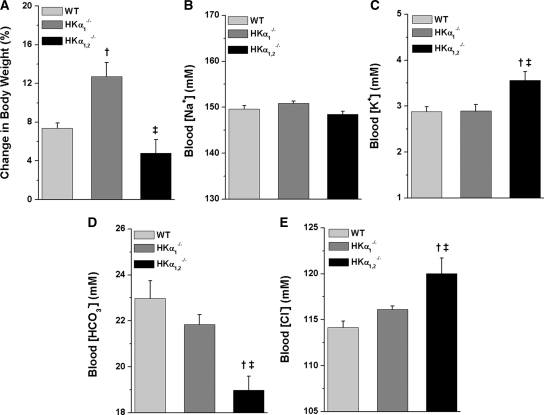
Figure 4.
DOCP treatment differentially affects body weight and blood [HCO3−] in WT and HKα-null mice. All data shown are from the eighth day of DOCP treatment. (A) Body weight change (%) is shown as the percent change in body weight from day 0. Arterial blood samples were collected from the aorta, and (B) blood [Na+], (C) [K+], (D) [HCO3−], and (E) [Cl−] were measured on a clinical blood gas analyzer. Data are presented as mean ± SEM and were analyzed by one-way ANOVA followed by post hoc Student-Newman-Keuls test. †P < 0.05 compared with WT; ‡P < 0.05 compared with HKα1−/− mice. n = 10 to 11 WT and n = 5 HKα1−/− and HKα1,2−/− mice.

