Figure 7.
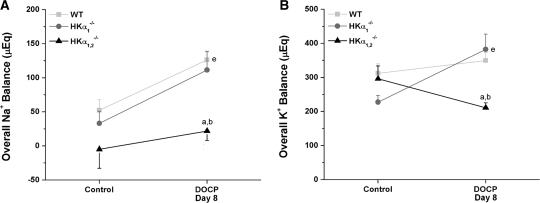
HKα-null mice display disturbances in overall electrolyte balance with DOCP treatment. Overall (A) Na+ and (B) K+ balance (μEq) are shown for WT, HKα1−/−, and HKα1,2−/− mice on the day preceding treatment (control) and on day 8 of DOCP treatment. Overall electrolyte balance was calculated as the amount of the electrolyte excreted in the urine and feces subtracted from dietary intake of that electrolyte. Data are shown as mean ± SEM and were analyzed by two-way repeated-measure ANOVA with post hoc Student-Newman-Keuls test or one-way repeated-measure ANOVA with post hoc Tukey test; P < 0.05 is considered significant. aSignificant difference from WT; bsignificant difference from HKα1−/− mice; esignificant difference from control within the same genotype. WT, n = 10; HKα1−/−, n = 4; HKα1,2−/−, n = 5.

