Figure 1.
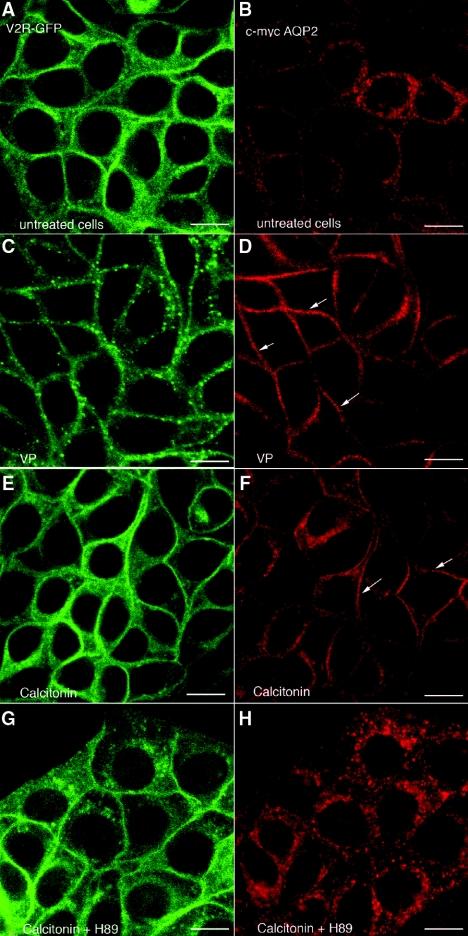
CT stimulates AQP2 accumulation in the plasma membrane of kidney epithelial cells without affecting V2R-GFP distribution. Confocal immunofluorescence microscopy shows V2R-GFP and AQP2 in LLC-VA cells before and after treatment with VP and CT with or without the PKA inhibitor H89. (A and B) In nonstimulated cells, V2R-GFP (green) is concentrated in the plasma membrane (A), whereas AQP2 (red) remains in cytoplasmic vesicles localized mainly around the nucleus (B). (C through F) In contrast, AQP2 shows plasma membrane localization (arrows) after incubation for 10 minutes with 10 nM VP (D) or 100 nM CT (F). V2R-GFP was partially internalized into cytoplasmic vesicles at this early time point after VP treatment (C), but its distribution was not changed by CT treatment (E). (G and H) The presence of H89 did not effect V2R distribution (G), but the effect of CT on the distribution of AQP2 was completely abolished in the presence of this inhibitor (H). These images are representative of three independent experiments. The bar indicates 10 μm.

