Figure 5.
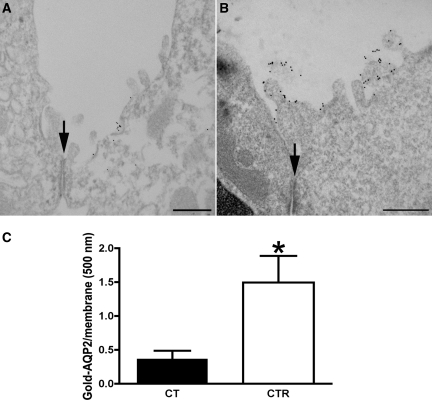
Immunogold electron microscopy shows apical plasma membrane insertion of AQP2 induced by CT in vivo. AQP2 was localized by pre-embedding labeling of thick, nonpermeabilized vibratome sections kidney cortical tissue with an antibody against an external epitope of AQP2. Only plasma membrane AQP2 is detected using this procedure. CT treatment (B) showed a significant amount of AQP2 plasma membrane associated with the apical membrane and microvilli, whereas AQP2 in the apical plasma membrane was much less abundant in cortical kidney sections of the untreated rats (A). These results support the epifluorescence microscopy data shown in Figures 6 and 9. The number of gold particles labeling AQP2 is expressed per micrometer of apical membrane length (C). Images of two to three tubules from each tissue were analyzed with ImageJ software (National Institutes of Health). The density of AQP2 at the apical plasma membrane (open bar) was compared with the density of AQP2 in the apical membranes of untreated rats (solid bar) (means ± SEM; n = 3; *P < 0.05). The position of the cell junction between a principal cell (B) and an AQP2-negative intercalated cell (A) is indicated with an arrow in each figure. The bar indicates 0.5 μm.

