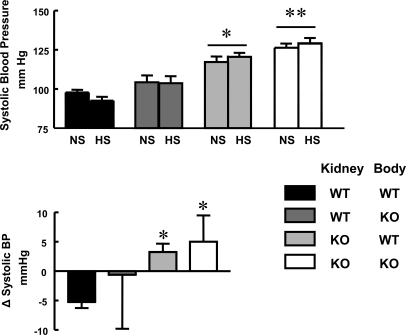
Figure 2.
High-salt diet increases systolic BP in mice with D5−/− kidneys. (Top panel) Systolic BP on normal (0.75% NaCl) and high sodium (6% NaCl) diets. The groups are as described for Figure 1. **P < 0.01 versus WT-WT and WT-KO; *P < 0.05 versus WT-WT and WT-KO. Two-way ANOVA followed by Student-Newman-Keul's test were used. (Bottom panel) BP change from normal to high salt diets in transplanted mice. The groups are as described above. *P < 0.05 versus WT-WT. A Kruskal-Wallis test followed by Dunn's test were used.

