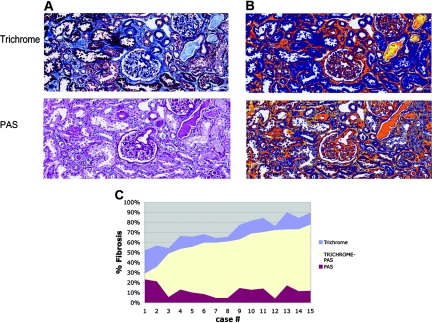
Figure 2.
Quantitation of fibrosis using Trichrome-PAS staining. (A) Trichrome and PAS stains. (B) The corresponding “mark-up” image generated by the quantitation algorithm applied to the Trichrome and PAS stains. Tissue considered “positive” is “marked up” either yellow, orange, or red, in that order, with increasing positivity of match to the algorithm parameters. Note that basement membranes, sclerotic glomeruli, and blood vessels stain with both the trichrome and PAS stains and are thus “subtracted” with the PAS stain. Tubular brush borders were not falsely detected. Casts stained with PAS stains were thus subtracted. (C) Graph of trichrome, PAS, and T-P fibrosis values for both days combined, arranged by increasing trichrome-PAS area.

