
Figure 4.
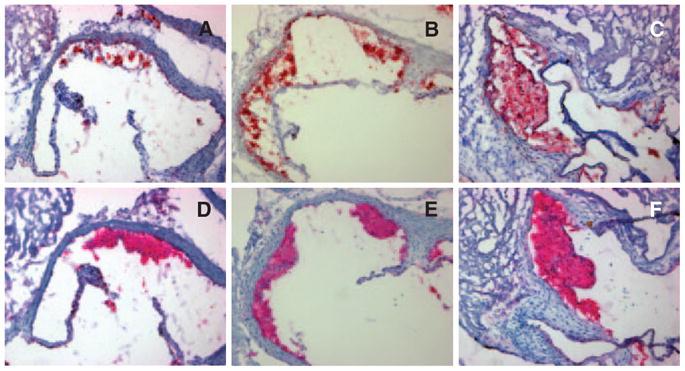
Representative histological photomicrographs. A through C, Oil red O staining for neutral lipids in representative aortic root sections of FA (A), FP (B), and UFP (C) mice. D through F, MOMA-2 immunohistochemical staining in adjacent aortic root sections to those shown in the top row, corresponding to the same FA (D), FP (E), and UFP (F) mice. Both oil red O and MOMA-2 staining yielded red-stained areas. UFP mice exhibited more extensive atherosclerotic plaques (C and F) than FP (B and E) or FA animals (A and D), all consisting primarily of foam cells and macrophages (fatty streaks). Original magnification, ×100.