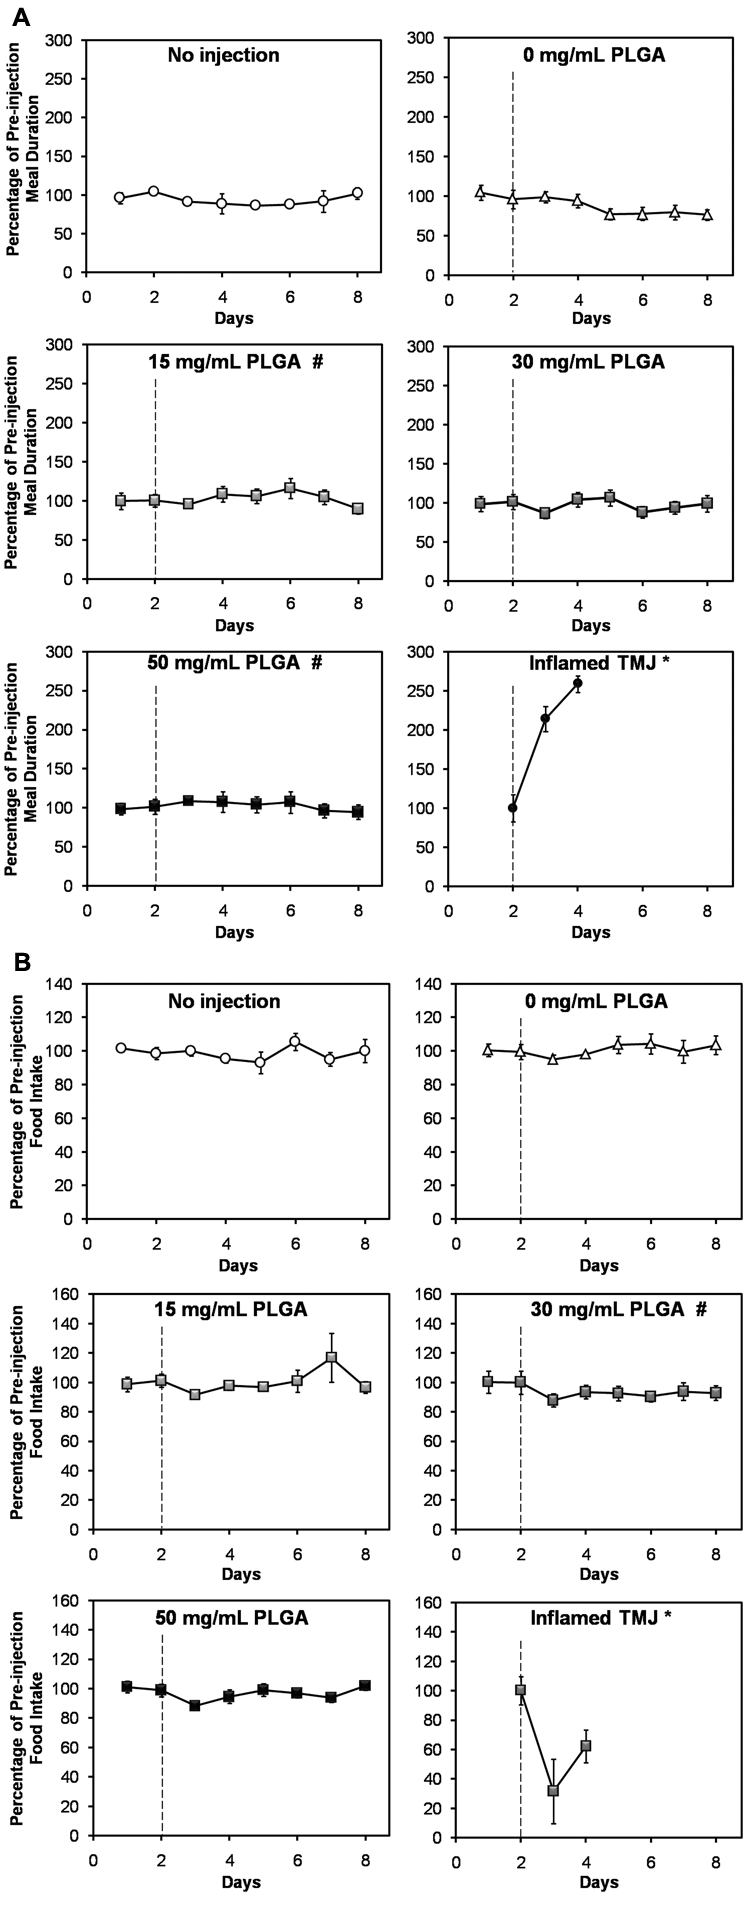
Figure 2.

Intra-articular microparticles did not induce TMJ pain or nociception, based on (a) meal duration and (b) food intake measurements for 2 days prior to and 6 days following intra-articular injection of 15, 30, or 50 mg/mL PLGA microparticle formulations (abbreviated “PLGA”). A dashed line indicates the time of injection. The upper panels of both (a) and (b) depict the 2 control groups, consisting of rats that did not receive any injections (“No injection”), and rats where only the carrier fluid was injected (“0 mg/mL PLGA”). (a) Meal duration differed significantly between the 0 mg/mL PLGA group and both the 15 mg/mL PLGA and 50 mg/mL PLGA groups (p < 0.05; indicated by #). However, none of the groups differed from the “No injection” negative control (p > 0.05). Meal duration data from a previous study where rat TMJ inflammation was induced via bilateral injection of a pro-inflammatory agent (15 µg CFA/joint; “Inflamed TMJ *” group) are included in (a) for comparison. In that study, a significant increase (p < 0.05) in meal duration was observed compared with the baseline pre-injection value (Bellinger et al., 2007). None of the groups in this study showed a significant increase in meal duration compared with baseline (p > 0.05). (b) Food intake differed significantly (p < 0.05) between the 30 mg/mL PLGA group and both the 15 mg/mL PLGA experimental group and the 0 mg/ mL PLGA control group. However, none of the groups differed from the “No injection” negative control (p > 0.05). Food intake results from a previous study where rat TMJ inflammation was induced via bilateral injection of a pro-inflammatory agent (300 µg CFA/joint; “Inflamed TMJ *” group) are included in (b) for comparison. In that study, a significant decrease (p < 0.05) in food intake was observed compared with the baseline pre-injection value (Harper et al., 2000). None of the groups in the present study showed a significant decrease in food intake compared with the baseline values (p > 0.05). Values for each group are expressed as a percentage of the average pre-injection value. Datapoints represent the mean ± standard error of the mean for n = 8 rats (or n = 3 rats in the “No injection” group). Error bars are included for all groups, though they are too small to resolve in some cases. Groups that differ significantly (p < 0.05) from “0 mg/mL PLGA” are indicated by #.
