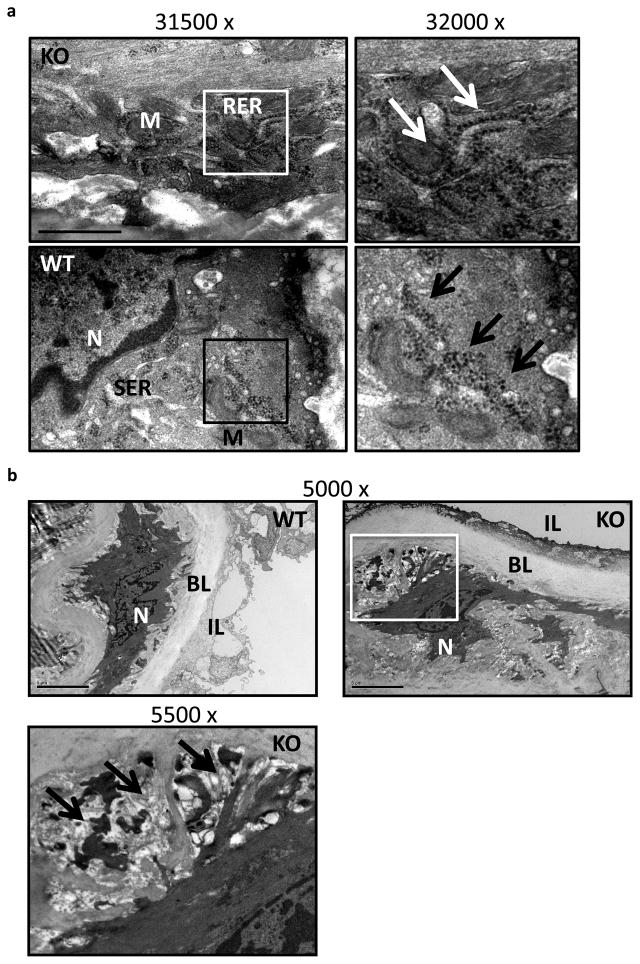
Figure 5. Electron microscopy on mouse aorta.
(a) Electron microscopy micrographs of miR-143(145) KO (KO) and wild-type (WT) aorta. M, mitochondria; RER, rough endoplasmic reticulum; SER, smooth endoplasmic reticulum; N, nuclei. Arrows indicate aligned ribosomes present on active RER, whereas they are organized in clusters all around the SER in WT aorta. Scale Bar = 1000nm.
(b) Micrograph of WT and miR-143/145 KO aorta (top panel), higher magnification image of the KO aorta on the bottom panel. N, nucleus; BL, basal lamina; IL, intima layer. Arrows indicate areas of ECM around a KO cell which shows cell protrusions. Scale Bar = 5μm.

