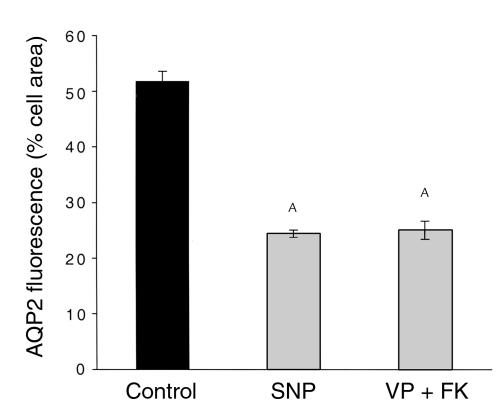
Figure 2.
Quantification of the effect of VP plus forskolin and SNP on AQP2 redistribution in collecting duct (inner stripe) principal cells. Total principal cell area (excluding the nucleus) and the area occupied by AQP2 fluorescence were determined using IP Lab Spectrum software on confocal microscope images as in Figure 1. Results are expressed as the percentage of total cell area occupied by AQP2 fluorescence. VP plus forskolin and SNP both induce a similar and marked reduction in the area of AQP2 fluorescence, indicating that these agonists cause the AQP2 staining to become concentrated in a smaller region of the cell, i. e., the apical pole. AP < 0.05 compared with the control value. FK, forskolin.

