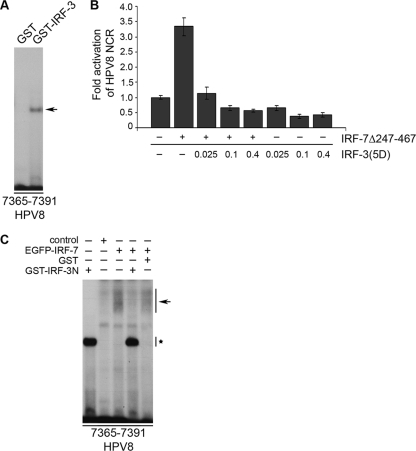
FIG. 6.
Suppression of IRF-3 dominates over the IRF-7 stimulatory effect. (A) Purified GST and GST-IRF-3 fusion proteins were incubated with 32P-labeled oligonucleotides (nt 7365 to 7391) comprising the IRF-BS and analyzed by EMSA. The IRF-3 band is indicated by an arrow. (B) RTS3b cells were transfected with the HPV8 NCR luciferase construct (0.5 μg) and increasing amounts of IRF-3(5D) (0.025, 0.1, and 0.4 μg) in the presence or absence of the IRF-7Δ247-467 (0.4 μg) expression vector. The total amount of DNA was adjusted with respective control vectors. The EGFP expression vector (0.25 μg) was cotransfected. After 24 h, the luciferase activity was measured and normalized to the protein concentration of the respective luciferase extracts and the percentage of EGFP-positive cells. The normalized luciferase activity of the control transfection was set at 1. Shown are the values averaged from two transfections performed in triplicate ± SD. (C) Nuclear extracts were isolated from RTS3b cells transfected with the pCAGGS control vector or GFP-IRF-7 expression vector and incubated with 32P-labeled oligonucleotides (nt 7365 to 7391). Purified GST or GST-IRF-3N proteins were used for competition in EMSA. An arrow indicates the IRF-7-specific band, which is reduced in the presence of GST-IRF-3N (asterisk).

