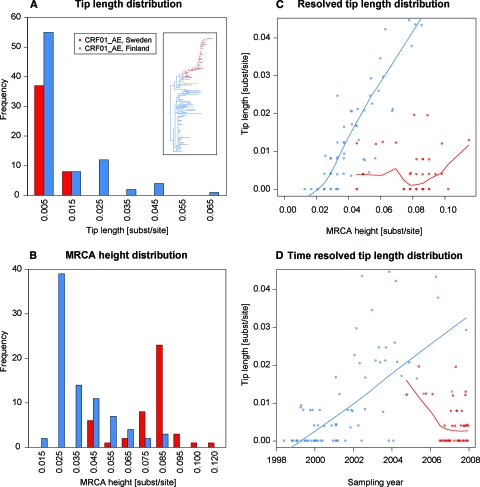
FIG. 2.
Detailed analysis of the CRF01_AE maximum likelihood tree. (A) Tip length distributions for the Swedish and Finnish sequences, shown at intervals of 0.01 substitution site−1. (B) Number of tips at a certain height from MRCAScand, measured to the internal node of the tip. Furthermore, the tip length distribution was resolved according to the height from MRCAScand to the internal node of each tip (the MRCA of each tip edge). (C) Loess regression for each geographical region. (D) Tip length distribution, resolved according to sampling dates of the taxa, with loess regressions.

