FIG. 3.
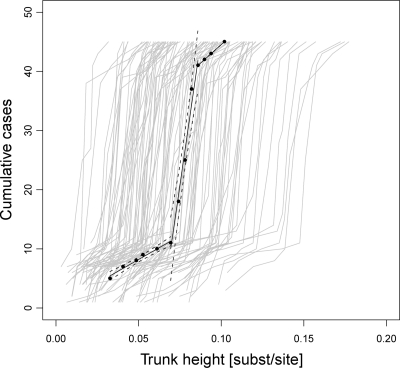
Cumulative history of Swedish CRF01_AE cases. Black points show the height of the trunk from MRCAScand (see Fig. 1). The black lines are ordinary least-squares estimates of the incidence rates inferred from the ML tree in Fig. 1, with the 95% regression confidence limits shown with dashed lines. The slope of phase 1 (preoutbreak) was 160 cases/trunk height (R2 = 0.97; P < 0.01; F test), phase 2 (the outbreak) had a slope of 1,930 cases/trunk height (R2 = 0.97; P < 0.01; F test), and phase 3 (postoutbreak) had a slope of 251 cases/trunk height (R2 = 1; P < 0.01; F test). The gray lines represent each of 100 bootstrap replicate trees. The three inferred bootstrap slopes were also well separated (P < 0.001; Wilcoxon rank sum test) (see Fig. S2 in the supplemental material). The initial spread rate of CRF01_AE in the ML tree (preoutbreak) was used to normalize the slopes in the figure to allow for relative rate estimation. The outbreak accumulated 12 times more infections per trunk height than those during the preoutbreak phase.

