Figure 3.
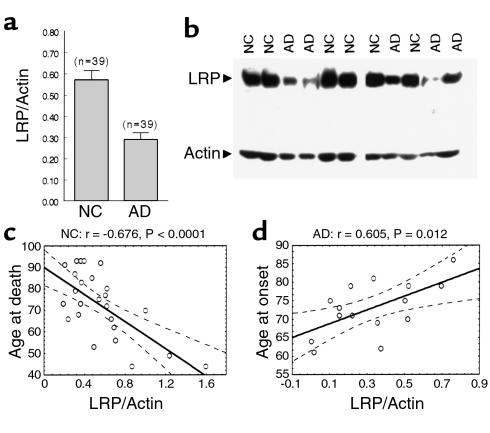
Association of brain LRP levels with AD susceptibility. LRP levels were quantitated by immunoblotting for the 85-kDa light chain of LRP and normalized to actin. (a) Comparison of AD and age-matched normal controls (NC) showed a significant difference in LRP levels (t = 4.884, df = 76, P < 0.0001). Error bars represent SEM. (b) Representative immunoblots containing LRP and actin signals from AD and NC samples are shown. (c) Levels of LRP in the brain are inversely correlated with age of control subjects (control subjects lacking APOE ε4 allele shown: r = –0.6758, P < 0.0001; all control subjects: r = 0.4905, P = 0.0015). (d) AD patients show a positive correlation between LRP levels and ages at onset of disease (AD subjects lacking APOE ε4 allele shown: r = 0.6048, P = 0.0116; all AD subjects: r = 0.33465, P = 0.0429). The regression slope (center line) and 95% confidence interval (two curved lines) are shown. The correlation coefficient (r) and P values are shown above the graph.

