Figure 4.
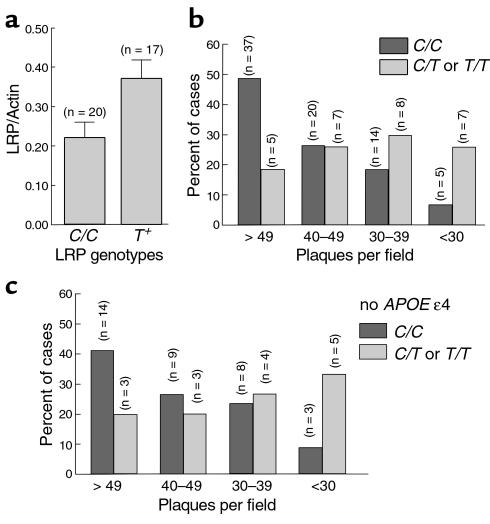
Association of LRP genotypes with LRP levels and amyloid burden in the AD brain. LRP levels were quantitated by immunoblotting for the 85-kDa light chain of LRP and normalized to actin. (a) AD patients harboring LRP T allele showed significantly higher levels of LRP in the brain (t = 2.335, df = 35, P = 0.0254). (b) AD brains were segregated into ordered categories of increasing amyloid burden, ranging from less than 30, 30–39, 40–49, and greater than 49 plaques per field and examined for association with LRP genotypes. The percentage and number of individuals within each plaque-per-field category are shown as a function of LRP genotypes. Statistical analysis shows an excessive overrepresentation of C/C genotypes across increasing plaques-per-field categories compared with T-positive genotypes (χ2 for linear trend = 11.762, df = 1, P = 0.0006). (c) The LRP effect on amyloid burden is still observed among subjects that do not carry the APOE ε4 allele (χ2 for linear trend = 6.135, df = 1, P = 0.0133).

