
TABLE 3.
Phe-based derivatives that induced Ca2+ mobilization in human neutrophils and FPR-transfected HL-60 cells
The EC50 values are presented as the mean ± S.D. of three independent experiments, in which median effective concentration values (EC50) were determined by nonlinear regression analysis of the dose-response curves (five to six points) generated using GraphPad Prism 5 with 95% confidence interval (P < 0.05). Efficacy is expressed as percentage of the response induced by 5 nM fMLF (FPR1) or 5 nM WKYMVm (FPR2 and FPR3).
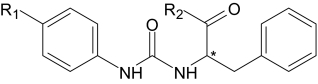
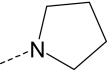
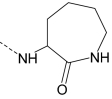
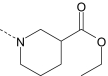
| Compound | R1 | R2 | Enan-tiomer | Ca2+ Mobilization,
EC50, and Efficacy |
|||
|---|---|---|---|---|---|---|---|
| Neutrophils | FPR1 | FPR2 | FPR3 | ||||
| μM (%) | |||||||
| AG-10/4 | Br |
|
S | 3.2 ± 0.6 (115) | 4.5 ± 1.1 (90) | 0.14 ± 0.05 (100) | 11.5 ± 2.8 (55) |
| AG-10/5 | Br |
|
S | 1.2 ± 0.3 (140) | 1.8 ± 0.5 (130) | 0.04 ± 0.02 (115) | 6.5 ± 1.7 (85) |
| AG-10/6 | Cl |
|
S | 0.5 ± 0.2 (140) | 2.9 ± 0.7 (100) | 0.05 ± 0.01 (95) | 3.1 ± 0.8 (65) |
| AG-10/7 | S-CH3 |
|
S | 6.6 ± 1.4 (50) | 6.0 ± 1.4 (45) | 0.3 ± 0.08 (75) | N.A. |
| AG-10/8 | Br |
|
S | 0.7 ± 0.2 (145) | 0.3 ± 0.08 (135) | 0.004 ± 0.002 (115) | 0.1 ± 0.03 (90) |
| AG-10/9 | Br |
|
S | 0.5 ± 0.1 (110) | 0.08 ± 0.02 (100) | 0.007 ± 0.003 (100) | 0.5 ± 0.1 (50) |
| AG-10/10 | Br |
|
S | 4.4 ± 1.2 (85) | N.A. | 0.16 ± 0.04 (85) | N.A. |
| AG-10/11 | Br |
|
R/S | 9.7 ± 0.2 (90) | 6.7 ± 1.6 (75) | 0.25 ± 0.06 (55) | N.A. |
| AG-10/12 | Cl |
|
S | 10.5 ± 2.6 (100) | 4.2 ± 0.9 (85) | 0.7 ± 0.3 (55) | N.A. |
| AG-10/13 | CH2CH3 |
|
S | 10.8 ± 2.2 (110) | 3.1 ± 0.7 (105) | 1.6 ± 0.3 (75) | N.A. |
N.A., nonactive compound (cell activation was <30% of control level over a concentration range of 0–40 μM).
*Location of the chiral center.