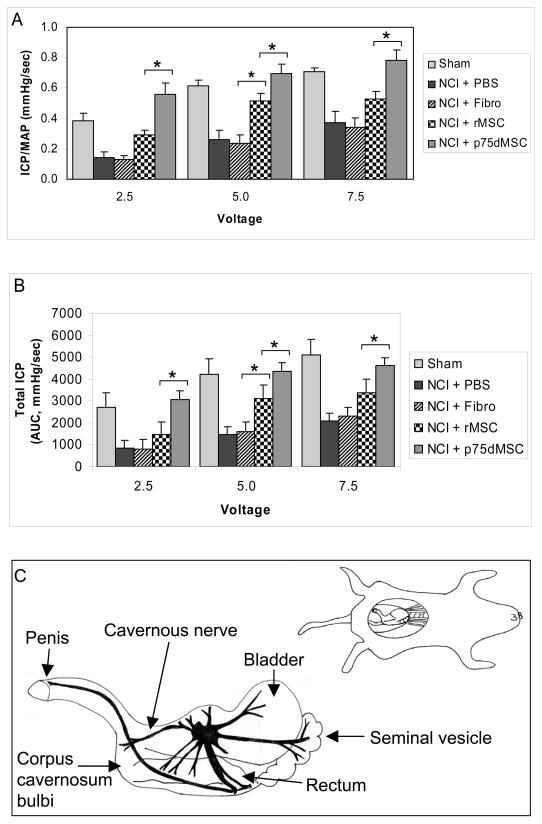
Figure 2.
Determination of intracavernous-to-mean arterial pressure ratio (ICP/MAP) and total ICP values to assess erectile function at 4 weeks after injury and treatment. A, Magnitude of the mean ICP/MAP. B, Mean total ICP. Cavernous nerve stimulation (CNS) at a frequency of 15 Hz. and pulse width of 30 milliseconds was performed in each rat. CNS at 2.5, 5.0 and 7.5 V was performed in the current protocol to achieve significant and consistent erectile responses. The duration of stimulation was 1 minute with a rest period of 3 to 5 minutes between subsequent CNS episodes. The total erectile response or total ICP was determined by the area under the curve (AUC) in mmHg/second from the beginning of CNS until the ICP returned to baseline or pre-stimulation pressure. The mean ICP-to-blood pressure ratio (ICP/MAP) at the peak erectile response was determined to control for variations in systemic blood pressure. C, Diagram of cavernous nerve anatomy and area of NCI. * p <0.05. Note: in all cases, PBS and fibro are significantly less than sham (p <0.05) and p75dMSC is significantly greater than PBS and fibro (p <0.05). NCI: Bilateral cavernous nerve-crush injury. N=8 animals per group.

