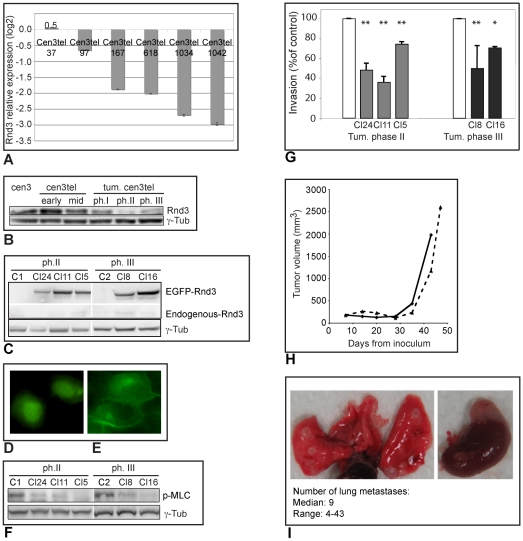
Figure 5. Rnd3 expression in cen3tel cells and its effect on their invasive and metastatic capacity.
A) Results of microarray analysis. Rnd3 expression in cen3tel cells is indicated relative to cen3 primary fibroblasts. The values are the average of the results for ten spots corresponding to the same probe for Rnd3 (bar: standard error); cen3tel at PD 1034 and at PD 1042 both represent cells of tumorigenic phase III. B) Western blotting analysis of Rnd3 expression in primary cen3 fibroblasts and cen3tel at different stages of transformation. γ-tubulin was used as loading control. C) Western blotting analysis of recombinant EGFP-Rnd3 expression in transfected clones. C1 and C2 are mock-transfected clones from phase II and III tumorigenic cen3tel cells, respectively (the endogenous protein and the recombinant one were detected on the same membrane with the anti-Rnd3 antibody, but part of the space between the two signals has been eliminated to make the figure smaller). γ-tubulin was used as loading control. D) Subcellular localization of EGFP (yellow signal) or E) of the EGFP-Rnd3 fusion protein in cells stably transfected with either the empty vector or the Rnd3 expression vector. The exogenous Rnd3 protein is localized around the plasma membrane and in the cytoplasm where there is a perinuclear accumulation. Images were taken using an optical microscope (60x objective). F) Western blot analysis of the levels of pMLC in Rnd3-expressing and mock-transfected clones (C1 and C2). γ-tubulin was used as loading control. G) Invasion of clones from phase II (grey bars) and III (black bars) tumorigenic cen3tel cells transfected with the Rnd3expression vector. Invasion is expressed as the percentage of invasion in cells transfected with the empty vector (white bars). The average of the results from at least two independent experiments is shown (*: p<0.05; **: p<0.001). H) Growth curves of tumors obtained in SCID mice after subcutaneous inoculation of phase III tumorigenic cen3tel cells, either mock-transfected (continuous line) or stably transfected with the Rnd3 expression vector (dashed line). I) Lungs (left) and adrenal gland (right) from SCID mice six weeks after intravenous inoculation of the mock-transfected phase III tumorigenic cen3tel cells; metastases are visible on both organs. In the box, the median number of metastases per animal and the range are reported.

