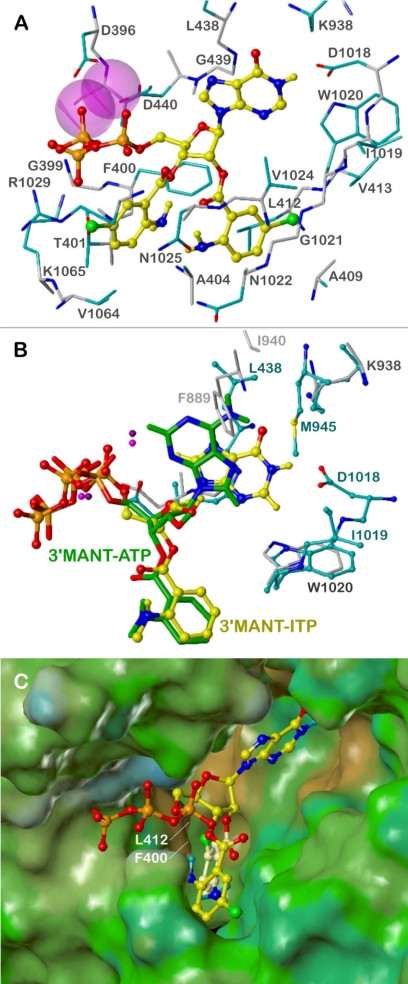
Fig. 5.
Interactions of (M)ANT nucleotides with mAC. The models are based on the crystal structures of mAC in complex with MANT-ITP, PDB 3g82, and with MANT-ATP, PDB 2gvz (Mou et al., 2006). Colors of atoms, unless otherwise indicated, are: orange, phosphorus; red, oxygen; blue, nitrogen; yellow, carbon, hydrogen; green, bromine; purple, Mn2+. A, suggested binding mode of bis-Br-ANT-ITP; amino acids within a sphere of ∼3 Å around the ligand are shown and labeled: carbon atoms of the backbone, gray; carbon atoms of side chains, cyan; Mn2+ ions represented by van der Waal radii. B, comparison of the binding modes of 3′-MANT-ITP (ball and stick model, yellow C atoms) and 3′-MANT-ATP (stick model, green C atoms); amino acids within a sphere of ∼3 Å around the nucleobases are shown and labeled (3g82, ball and stick model, cyan labels and C atoms; 2gvz, stick model, light gray labels and C atoms; both structures, dark gray labels). C, binding site of bis-Br-ANT-ITP, represented by the lipophilic potential mapped onto a MOLCAD Connolly surface (brown, hydrophobic areas; green and blue, polar areas); bis-Br-ANT-ITP in ball and stick model, the 2′-Br-ANT group is highlighted by light yellow carbon atoms.

