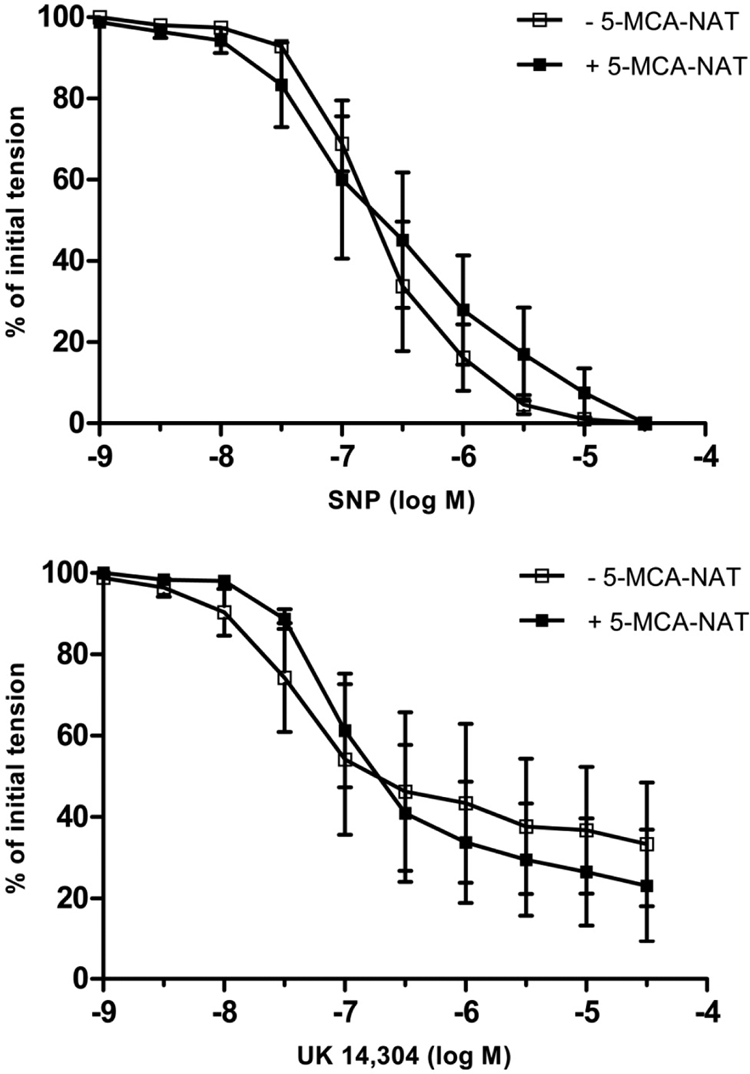
Fig. 4.

Log concentration-response curves for SNP (top) or UK14,304 (bottom) in producing relaxation of isolated porcine coronary arteries in the absence and presence of 5-MCA-NAT (10−7 M). Data are expressed as a percentage of the initial increase in tension induced by U46619 (1–3 × 10⁻⁹ M), which averaged 5.09 ± 0.9 and 5.15 ± 0.7 g in the absence and presence of melatonin, respectively (P > 0.05; Student's t test). Each point represents the mean ± S.E.M. (n = 4).
