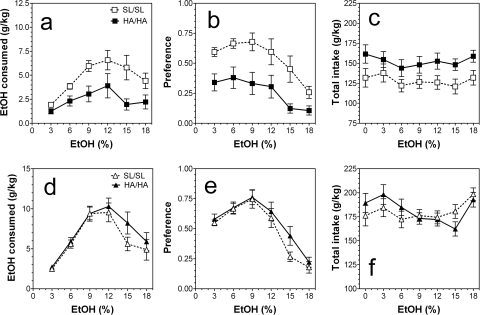
Fig. 6.
Ethanol intake in a two-bottle choice test with 24-h continuous access to ethanol. a–c, male mice. a, amount of ethanol consumed given as g/kg/24 h. b, preference for ethanol as a percentage of fluid intake. c, total fluid intake given as g/kg/24 h. Mutant male mice consumed smaller amounts of ethanol (p < 0.001; two-way ANOVA) with reduced preference for ethanol (p < 0.001; two-way ANOVA) than their wild-type littermates. Total fluid intake was elevated in mutant male mice (p < 0.001; two-way ANOVA) (n = 10 per genotype). d–f, female mice. d, amount of ethanol consumed given as g/kg/24 h. e, preference for ethanol as a percentage of fluid intake. f, total fluid intake given as g/kg/24 h. No differences between mutant and wild-type female mice in ethanol intake, preference for ethanol, or total amount of fluid consumed were found (two-way ANOVA) (n = 9–10 per genotype). Values represent mean ± S.E.M.

