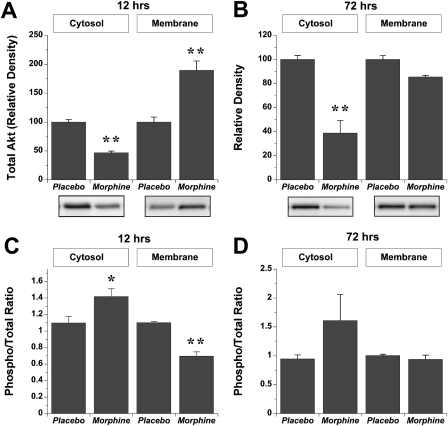
Fig. 6.
Effects of morphine-dependent induction of SLP on Akt expression in cytosolic and membrane fractions. Data are shown for total Akt at 12 h (A) or 72 h (B) and for the ratio of phosphorylated/total Akt at 12 h (C) or 72 h (D). Expression of total Akt (A and B) is normalized to levels in placebo hearts. Data are means ± S.E.M. *, P < 0.05 versus placebo; **, P < 0.01 versus placebo.

