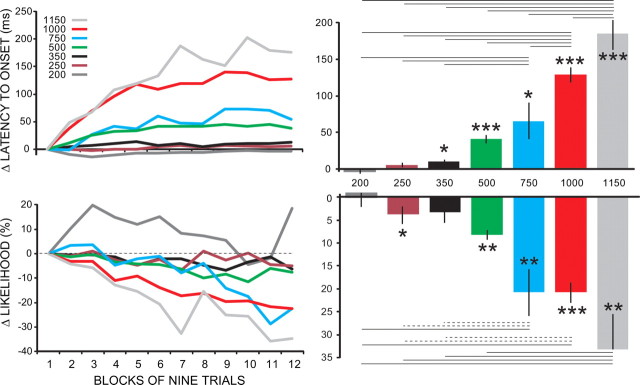
Figure 3.
The effect of ISI on within-session changes of conditioned responses. Separate groups of animals were trained using ISIs of 200 ms (n = 4), 250 ms (n = 8), 350 ms (n = 8), 500 ms (n = 34), 750 ms (n = 8), 1000 ms (n = 21), and 1150 ms (n = 7). For the panels at left, the data were normalized as in Figure 2 (as a difference score relative to block 1) and averaged over the last two sessions of training for each animal (the total number of sessions varied from animal to animal, but performance was at asymptote for both). The graphs at right plot the same data as a single difference score (average of the last three blocks relative to first block) for all seven groups. There were significant increases in latency to onset and decreases in conditioned response likelihood that generally increased with the ISI. In the right panels, the asterisks denote significant differences from no change (*p < 0.05, **p < 0.01, ***p < 0.001). The horizontal lines denote significant differences between groups (Tukey test), where dotted lines denote p < 0.05 and solid lines denote p < 0.01).

