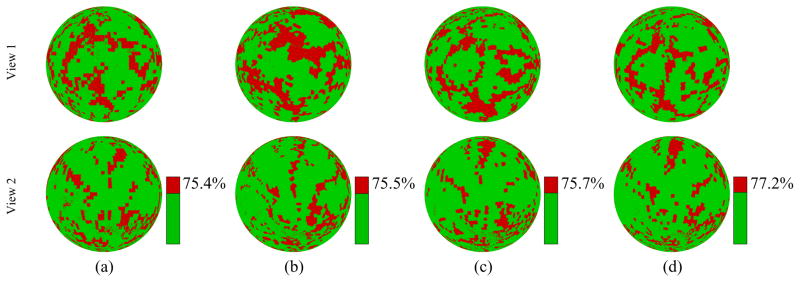
Fig. 4.
A visualization of the error on the spherical mapping of one subject (subject 18): red area indicates and green area indicates . The top and bottom rows show the views that are the same as and diametrically opposite to the one used in Fig. 1(c), respectively. (a–d) the results from M1, M2, M3, and the proposed method, with green area accounting for 75.4%, 75.5%, 75.7% and 77.2% of the sphere, respectively.

