
Figure 4.
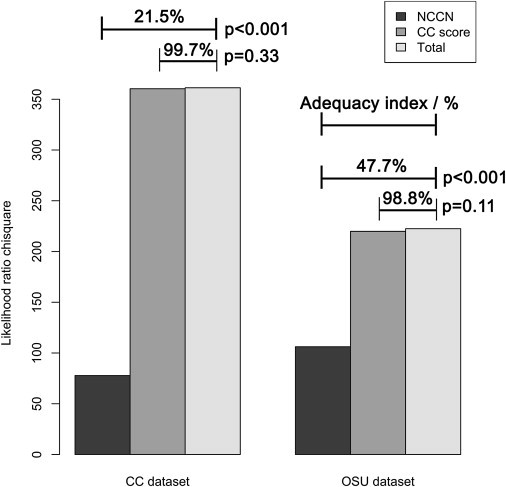
A Graph Showing that the CC Score Yields Superior Predictions Relative to the NCCN Criteria in Both the CC and the OSU Data Sets
Each data set shows corresponding likelihood ratio chi-squares for the NCCN criteria, the CC score, and a full model comprised of both criteria. The CC score confers statistically significant benefit to the NCCN criteria in PTEN mutation prediction, but the NCCN criteria do not confer benefit to the CC score. Higher adequacy indices are observed for the CC score relative to the NCCN criteria in both data sets.