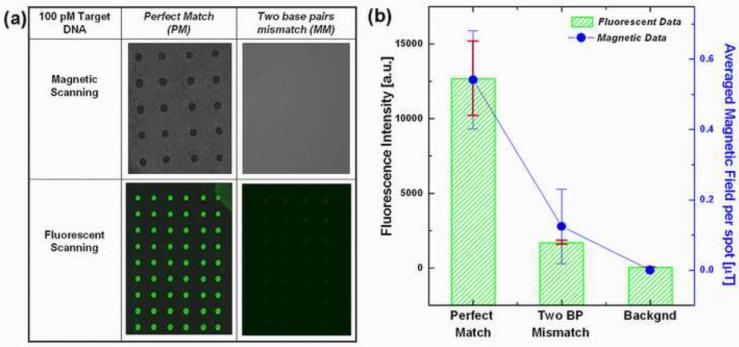
Fig. 5.
Sequence selectivity of both the fluorescent and magnetic labeled assay, where 100 pM of target DNA with complementary and two base pairs mismatch sequences were hybridized with probe DNA spotted on the glass slide. (a) Table of optical micrographs showing the magnetically and fluorescently labeled DNA microarrays having different label concentrations for a perfect match and two base pair mismatch targets, (b) Comparison of the fluorescent and magnetic field intensities for the perfect and mismatched targets. Points represent the average fluorescence intensities from more than 60 replicate test probe spots, from two separate glass slides under two separate labeling experiments. Error bars represent the standard deviation at each point.

