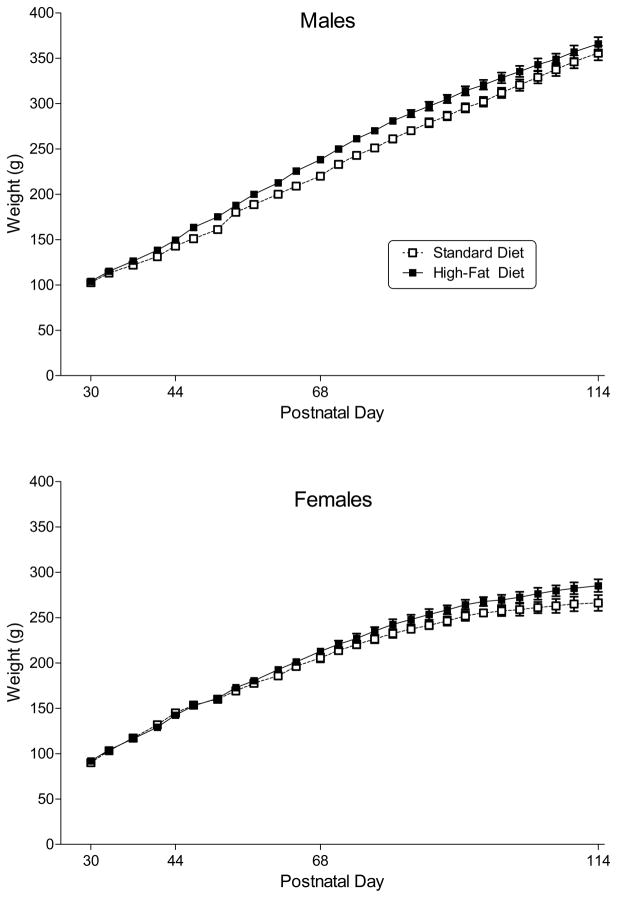
Figure 1.
Body weight (in g) across development in male and female rats (top and bottom panel, respectively) fed a standard or high-fat diet during adolescence and early adulthood. Open squares represent mean (± SEM) for rats fed a standard diet (n=8–9). Filled symbols represent mean (± SEM) for rats fed a high-fat diet (n=9). Main effects for postnatal day and for diet were significant for rats of both sexes; however, day X diet interaction was not significant for either sex.

