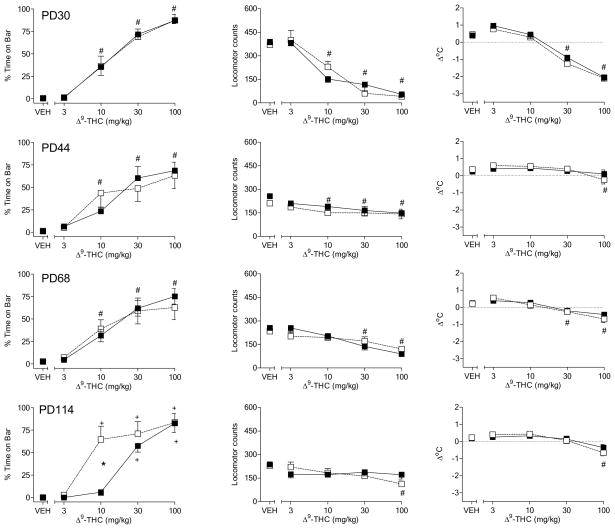
Figure 2.
Effects of cumulative doses of Δ9-THC on catalepsy-like behavior (% time with forepaws on bar) [left panels], locomotor counts (middle panels) and change in rectal temperature (right panels) in male rats on PD30 (top row of panels), PD44 (2nd row of panels), PD68 (3rd row of panels), and PD114 (bottom row of panels). Open squares represent mean (± SEM) for rats fed a standard diet (n=8). Filled symbols represent mean (± SEM) for rats fed a high-fat diet (n=9). # indicates significant main effect of dose. * indicates significant interaction and post-hoc between-diet difference (p<0.05). + indicates significant interaction and post-hoc difference (p<0.05) of dose compared to vehicle for the indicated diet group.

