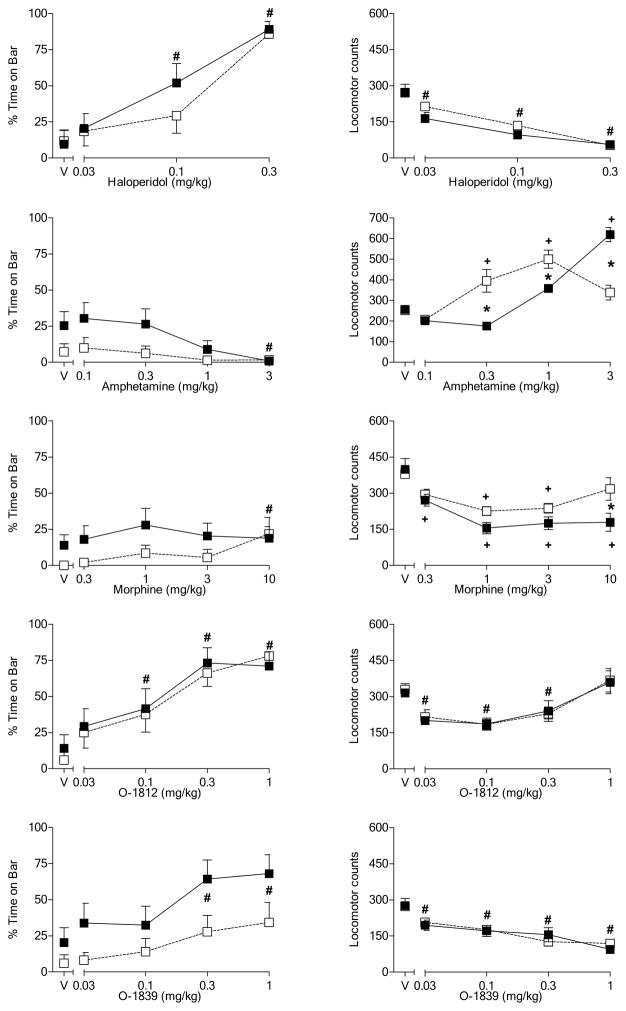
Figure 4.
Effects of cumulative doses of haloperidol (top panels), amphetamine (2nd row of panels), morphine (3rd row of panels), O-1812 (4th row of panels) and O-1839 (bottom row of panels) on catalepsy-like behavior (% time with forepaws on bar) [left panels] and locomotor counts (right panels) in female rats previously tested with Δ9-THC (see Figure 2). Open squares represent mean (± SEM) for rats fed a standard diet (n=9). Filled symbols represent mean (± SEM) for rats fed a high-fat diet (n=9). # indicates significant main effect of dose. * indicates significant interaction and post-hoc between-diet difference (p<0.05). + indicates significant interaction and post-hoc difference (p<0.05) of dose compared to vehicle for the indicated diet group.

