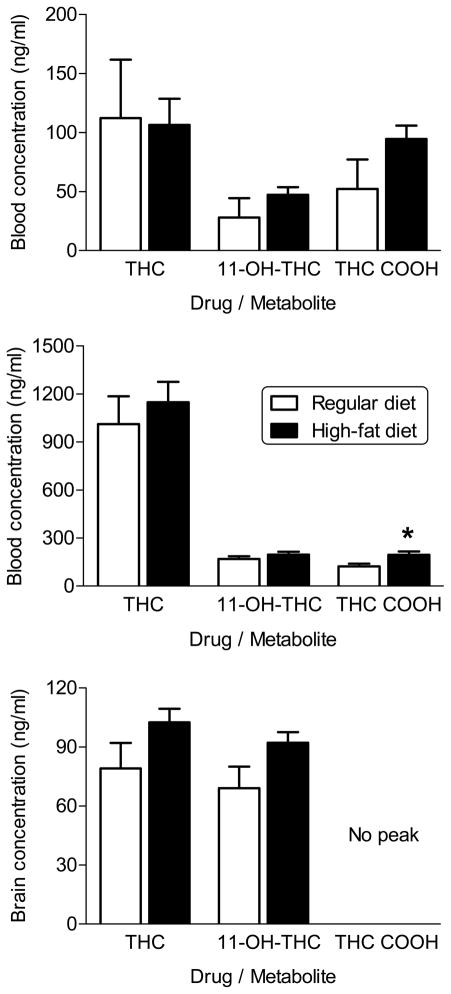
Figure 5.
Effects of diet on blood and brain levels of Δ9-THC and its major metabolites, 11-OH-THC and THC-COOH, in female rats. Blood levels were assessed on PD205 following injection with 10 mg/kg Δ9-THC (top panel) and at completion of the study after injection with 30 mg/kg Δ9-THC (middle panel). Brain levels were assessed at the end of the study after injection with 30 mg/kg Δ9-THC (bottom panel). Open bars represent mean (± SEM) for rats fed a standard diet (n=9). Filled bars represent mean (± SEM) for rats fed a high-fat diet (n=9). * indicates significant difference of value for high-fat diet versus corresponding value for standard diet.

